

Despite
Unprecedented Heat Transfer to Oceans, NASA Shows January 2014 was
3rd Hottest On Record; Models Hint at El Nino, Big Atmospheric
Temperature Jump on Horizon


19
February, 2014
A
cycling between warm ocean surface waters and cool ocean surface
waters in the Eastern Pacific called El Nino and La Nina, for
centuries, has been a primary driver of relative atmospheric warmth
and coolness. During the times when the Eastern Pacific disgorged its
heat, the Earth’s atmosphere warmed. And during times when the same
region cooled, a portion of atmospheric heat was taken back and
transferred into the world’s oceans.

(ENSO
Index since 1950. Image source: ESRL/NOAA.)
Since
about 1300 CE, this cycling governed the top and bottom ends of
average global climate. Temperatures during this time remained within
about .3 degrees Celsius of a very stable base line. But beginning
around 1900, that cycle was broken, with unprecedented and rapidly
increasing warmth proceeding along with an explosive human use of
fossil fuels.
Since
that time, and especially since the late 1970s, the regular El Nino
and La Nina cycle has been a less and less reliable governor of
atmospheric temperatures. Certainly the El Nino years were generally
hotter — a majority of El Nino years since 1980 were record hot
ones. And the La Nina years were definitely cooler. But the overall
temperature curve skewed upward and even La Nina years featured
within the range of top ten hottest years on record with increasing
frequency.
The
past five year trend only showed a more extreme amplification, when
taken in the broader context of an ongoing ocean heat transfer.
The
last El Nino year, 2010, was also the last hottest year on record.
Being a relatively lack-luster El Nino, with only moderate warm
temperature departures for the Eastern Pacific, it is abundantly
clear that human-caused global warming was the underlying driver for
this record breaker.

(Global
Temperature variation since 1880. Image and data source: NASA
GISS.)
In
the years that followed, 2011 and 2012 featured La Ninas while 2013
was a year in which the Eastern Pacific is neither warm nor cool
(ENSO neutral).
In
a normal world, under normal climate conditions, such a long period
of cool surface waters covering the Eastern Pacific would have driven
global temperatures down below typical averages. The vast waters
would have sucked heat out of the air and deposited it into the
oceans. And, as we will see below, it did suck a massive amount of
heat out. But not enough even to bring global temperatures back into
the average range, much less put it below the average (both NASA and
NOAA show 2011-2013 as top 10 hottest years on record). This is very
concerning, especially when we consider, as we do below, that
the rate of atmosphere to ocean heat exchange is currently
unprecedented.
Despite
four years of ongoing coolness in the Eastern Pacific and of a much
more vigorous than usual mixing of ocean and atmosphere, global
surface temperatures have remained at or near record highs during a
time that should have featured a down-turn. Meanwhile, ocean heat
content spiked.
And
the start of 2014 is no exception.
Third
Hottest January On Record
Come
January 2014 with ENSO still remaining on the cool side of neutral,
reports from NASA GISS show January 2014 was the third hottest in the
climate record since measurements began in 1880. NASA’s
Land-Ocean Temperature Index reveals
temperatures for the month at .70 degrees Celsius hotter than the
1950 to 1980 average and .90 degrees Celsius hotter than the annual
average for 1880.

(Global
Surface Temperature Anomaly in degrees Celsius of departure from the,
already warmer than normal, 1951-1980 average. Image source: NASA
GISS.)
By
contrast, January of 2002 and 2003, which were both El Nino years,
tied for second hottest in the record at .72 degrees Celsius hotter
than the average while 2007, also an El Nino year, showed January at
.93 C hotter than average. So the temperatures we are seeing this
year, a year in which the Eastern Pacific is still sucking up
atmospheric heat, are nearly as warm as recent times in which that
same vast stretch of ocean was bleeding heat back to the airs above
it.
For
atmospheric temperatures to be so hot without the presence of El Nino
is, today, an ominous sign for many reasons. First,
we are seeing amazing heat spikes in the Arctic.
And these spikes largely drove the January temperature anomaly — a
clear sign that northern polar amplification is becoming a powerful
driver of continued atmospheric warming in its own right. One that
may play a harmonic role with the ENSO cycle as the next few decades
progress. Second, we may be beginning to see that the ocean, which
has taken up so much excess atmospheric heat is starting to lag as a
sink even as it is grudgingly shoved back toward dumping a portion of
that extraordinary excess warmth into the atmosphere.
As
mentioned above, we have seen an unprecedented transfer of heat into
the surface, middle and deep ocean over the past decade. And the Argo
float graph below bears a stark testimony to this transfer:
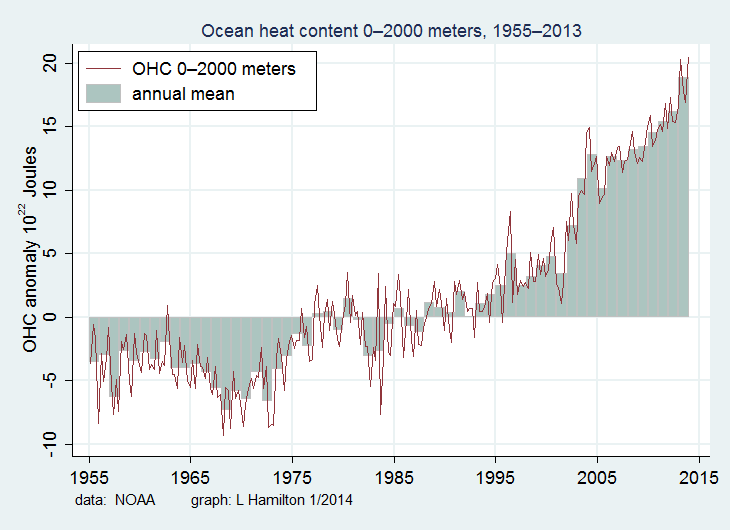
(Image
source: L Hamilton. Image data: NOAA. Produced for The
Arctic Ice Blog.
Note the extraordinarily steep slope indicating recent ocean
warming.)
Note
the huge jump in ocean heat content that began in 2001 just as the
most recent negative PDO and La Nina cycle began to kick in. This
vast heat content is now a latent source for atmospheric warming that
will, as many scientists note, almost certainly come back to haunt us
once the ocean heat uptake mechanism is exhausted.
This
Unprecedented Heat Transfer
The
graph above provides us with much cause for concern, as ocean heat is
certainly spiking. But a recent study provides yet another important
indicator — an extraordinary jump in trade wind intensity.
A
primary driver of the strength of La Nina and its ability to transfer
atmospheric heat into the oceans is the corresponding strength of the
east to west trade winds blowing across the Pacific. A strong trade
wind blowing over South America and shoving a huge pile of water
across the Pacific from east to west generates vigorous upwelling.
The strong upwelling, in turn, transfers relatively cool deep ocean
waters to the surface, where they take up atmospheric heat. When the
trades weaken, the opposite occurs and warmth builds up in the
surface waters along with a corresponding shift to El Nino.
Given
these factors, it
is important to note that a recent study has found that the trade
winds over the past decade have been their strongest since at least
1910 with
the wind continuing to strengthen and intensify well into 2012.

(Global
temperature and wind anomalies with IPO overlay. Negative departures
in the lower graph indicate unprecedented trade wind strength through
2012. Image and data source: England
Study.
Note — IPO stands for Interdecadal Pacific Oscillation, a condition
related to El Nino and La Nina cycling over decadal periods.)
With
such strong trade winds blowing over the Eastern Pacific, we are
seeing an unprecedented transfer of heat from the atmosphere to the
ocean (validated by both the trade winds data and the Argo float
data). And given the strength of this transfer, we should be seeing
some of the strongest La Ninas on record. But the ocean is now too
warm for that, so instead we are seeing consistent La Ninas of normal
caliber over the past 14 year period. A set of La Nina’s consistent
enough to shift the Pacific Oscillation into a negative mode and,
according to the England study, to temporarily suppress overall
atmospheric warming by between .1 and .2 degrees Celsius.
And
what this means is that when we see the period of consistent La Ninas
end and shift to a time of more consistent El Nino events, that .1 to
.2 degree Celsius heat transfer from atmosphere to ocean will stop
and we will likely see a correspondingly rapid jump in air
temperatures.
“the heat uptake is by no means permanent: when the trade wind strength returns to normal – as it inevitably will – our research suggests heat will quickly accumulate in the atmosphere. So global temperatures look set to rise rapidly …”
Model
runs conducted by the England study that take into account trade wind
strength and rate of heat transfer into the oceans show an
extraordinarily vigorous increase in global temperatures of .2 C to
.4 C by 2020 once the global trade winds return to normal. This,
potentially very rapid, jump in atmospheric temperatures could be
seen over a very short period during the next six years once the
trade winds abate and the Eastern Pacific settles again into a more
consistent period of El Ninos.
Models
Show El Nino May be on the Horizon for 2014
Meanwhile,
NOAA models are also beginning to hint that the hammer of Pacific
Ocean heat may well be starting to fall. A majority of model runs, as
of late January, were showing El Nino emerging in the Pacific by
summer of 2014. Five models showed El Nino on the 9 month horizon,
while two showed La Nina and three showed ENSO neutral conditions.
The
NOAA Earth Systems Research Laboratory explained
these findings:
Of the 10 nearest ranked December-January cases since 1950, FIVE rose to at least weak El Niño status within the next nine months (two within the next three months), while the count of weak or stronger La Niña rankings added up to two cases (1961 and 1967) after nine months. This confirms a noteworthy shift in the odds towards El Niño development in 2014 that was first pointed out two months ago. Compared to last month, the number of cases ending up as ENSO-neutral has dropped to 6 in three months, 5 in six months, and only 3 in nine months (September-October).
… While ENSO-neutral conditions are the safest bet for the next few months, a transition towards El Niño by mid- or late 2014 would not be surprising, perhaps even overdue.
How
the Temperature Jump May Unfold
In
light of the above reports, it is important to again state how rapid
an atmospheric temperature increase of .2 to .4 C over the course of
six years is. By comparison, the average decadal increase has been
about .15 to .2 C for each 10 year period since the 1970s. So the
England study suggests that atmospheric heating could double the
usual rate between now and 2020.
What
we would expect under such conditions is a gradual abatement of the
current and unprecedented trade wind strength over the Pacific Ocean.
As the trades weaken, the pool of very hot, deep water east of
Australia and the Philippines would begin to shift eastward even as
the Eastern Pacific took on uncharacteristic warmth. The long period
of mixing with a rapidly heating atmosphere will have created an
amazingly large and deep pool of hot water whose intensely high
temperature anomalies become increasingly evident at the surface. The
hot zone, in this case, exceeds even the extreme anomalies seen
during 1998 for this critical region and a massive heat dump into the
atmosphere begins.
At
this point, single year variations above past record highs may reach
or exceed +.1 C or more for multiple years running.
The
unprecedented heat bleed from the Pacific doesn’t occur without a
number of severe weather consequences. Especially under the gun for
this, most recent, potential event of human caused climate change is
California and the Desert Southwest. Having labored under drought
since the early 2000s, the region sees a radical shift to
unprecedented stormy conditions. During winter, a massive flow of
heat driven moisture rides up from the Pacific and arcs over
California carrying with it a stream of storms. The stormy period
drags out for weeks, beginning
to resemble the megastorm of centuries past.
Cities and industries laboring under the strain of too little water
see a sudden and radical, though brief, shift in the opposite
direction. California, under the gun for tens of billions of dollars
in damages from water shortages and drought instead falls under the
gun for possibly hundreds of billions of dollars in storm damages.
El
Nino related weather extremes crop up in Africa, Australia, the US
East Coast, India, the Pacific Northwest, and in other locations. In
all cases the extremes are far more radical than for a typical El
Nino year.
Under
such a regime, it is likely that global surface temperatures could
reach 1 degree Celsius above the 1950 to 1980 average and 1.2 degrees
Celsius above the average seen during 1880 by 2020. Very dangerous
warming and related extreme weather would be well underway at this
time under such conditions along a path toward an even more difficult
and violent climate scenario to follow.
Links:
No comments:
Post a Comment
Note: only a member of this blog may post a comment.