

AGU 2015: Scientists offer latest update on worsening state of Arctic

16
December, 2015
Scientists
at this year’s American
Geophysical Unionconference in San Francisco, the largest coming
together of earth and space scientists in the world, have issued
their latest health-check for the Arctic.
Compiled
by more than 70 authors in 11 countries, the annual Arctic
Report Card put
together by the US National Oceanographic and Atmospheric
Administration (NOAA)
is considered the most comprehensive overview of the state of the
polar north.
This
year’s instalment tells the familiar story of an Arctic in serious
decline. Temperatures are rising and ice is retreating, with knock-on
effects for Arctic ecosystems and wildlife.
Dr
James Overland,
an Arctic oceanographer with NOAA and one of the report’s authors,
told Carbon Brief:
The
importance of the report card is that almost every year we see new
surprises in the rapidity of the types of changes that we’re
seeing.
Here’s
your one-stop-shop for understanding what’s been going on in the
Arctic this year.
Vital
signs
Arctic
temperatures are rising more than twice as fast as the rest of the
world, today’s report begins. For the 12-month period between
October 2014 and September 2015, temperatures were 1.3C
above the long-term average,
the highest since 1900. In all four seasons, temperatures over large
parts of the region exceeded 3C above the pre-industrial era.
These
latest figures represent a warming of 2.3C since the 1970s and 2.9C
since the start of the 19th century. And while the surface
temperature of the globe as a whole has risen more slowly in the past
decade than previous ones, there has been no such slowdown in the
Arctic, the report notes. Compare the blue line in the graph below,
which shows the average annual temperature since 1900, with the red
line, which shows the same but for the whole globe.
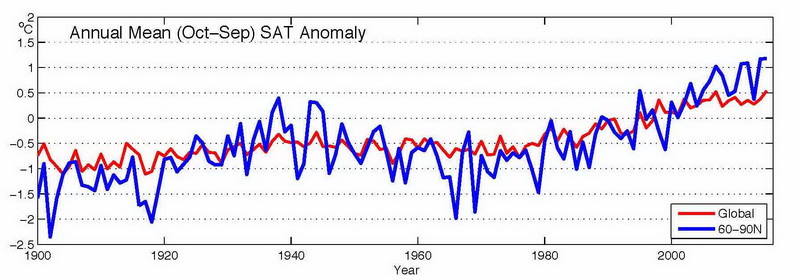
Annual
average surface temperature for Arctic land stations above 60N
(blue) and global (red) for the period 1900-2015, relative to the
1981-2010 average. Overland
et al (2015) NOAA
Arctic Report Card: Update for 2015.
While
you can see ups and downs in Arctic temperature (blue line above)
from one year to the next, the long term trend is one of clear
warming, today’s report explains:
Although
there are year-to-year and regional differences in air temperatures
due to natural random variability, the magnitude and Arctic-wide
character of the long-term temperature increase is a major indicator
of global warming.
These
natural fluctuations also mean that scientists see differences from
one Arctic region to another in any given season, the report
explains.
Greenland
in decline
Since
satellite records began in the late 1970s, they have shown Arctic ice
decreasing in response to rising temperatures – and this year is no
different, today’s report explains.
For
the first time since the record year of 2012, ice melted over more
than 50% of
the surface of Greenland. The melt season lasted a record-breaking
30-40 days longer than usual over some, but not all, of the ice
sheet. Between April 2014 and April 2015, Greenland lost 186bn tonnes
of ice, according to measurements from NASA’s GRACE satellites,
which measure changes in Earth’s gravitational field. This is about
20% less than the average per year over the whole satellite record
(2002-2015), but continues the long-term downward trend.
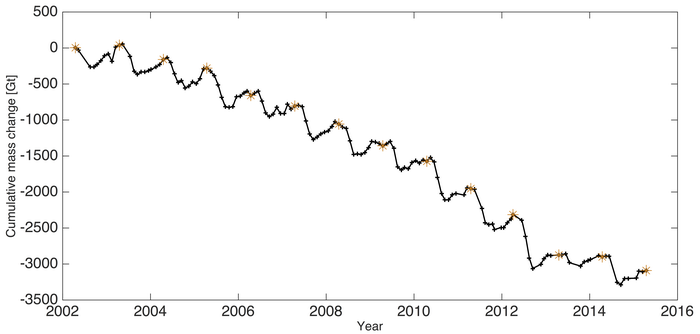
Total
ice loss from Greenland between 2002-2015, as measured by the GRACE
satellite. Orange stars are the cumulative mass loss as measured in
April of each year. 1GT is 1 gigatonne or 1 billion tonnes. Tedesco
et al. (2015) NOAA
Arctic Report Card: Update for 2015.
Sea
ice status
Every
year, Arctic sea ice reaches its seasonal high in March as winter
draws to a close. But the winter peak in 2015 was the smallest since
1979 and occurred about 15
days earlier than usual,
the report notes. The seasonal summer low in September was also
the 4th
lowest on record.
It’s
not just the amount of sea ice each year that’s changing, it’s
the nature of it, too. Only 3% of ice cover at the winter maximum was
more than four years old, while 70% was first-year ice. Go back 30
years and the picture looked very different. In 1985, older sea ice
made up a much bigger proportion – about 20% – and ice less than
a year old contributed just 35%.
Declining
even faster than sea ice is summer snow cover, the report notes.
Having never previously dropped below 3m square kilometres
in the 43-year long record (1967-2008), snow cover in June dropped
below this level in five
years out of the last six.
As a result, the combined discharge of the 10 biggest rivers in the
Arctic in 2015 was 10%
greater than
long-term average.
Arctic
ecosystems
Changes
in the sea ice are having profound impacts on species that call the
Arctic home. One example today’s report highlights is the iconic
walrus.
It’s a complicated picture and data is lacking in some places, but
scientists project diminishing sea ice will reduce their access to
prey and cause the animals to come ashore in huge numbers more
frequently – known as “haul outs”.
Habitat
loss is likely to be exacerbated by
other climate-change related factors, such as ocean acidification, as
well as shipping, oil and gas development and contaminants, the
report notes.
Sea
ice loss and rising temperatures in the Barents Sea are also causing
fish species to migrate
northwards towards
the poles away from their usual
habitats further south,
the report notes.
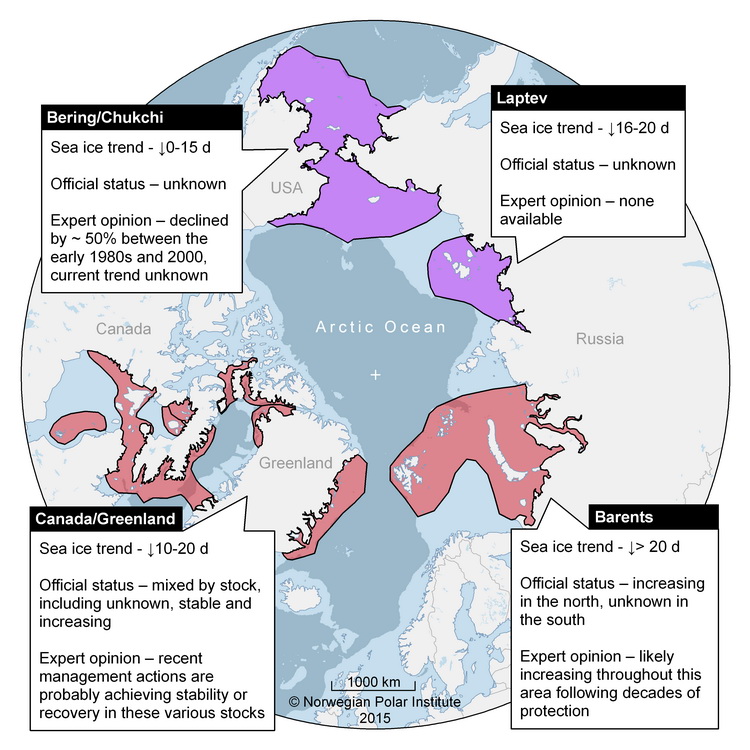
Sea
ice trends and the status of walrus populations across the Arctic.
The downwards arrows represent a loss of sea ice while the number
denotes the number of days less ice coverage per decade. Kovacs
et al. (2015) NOAA
Arctic Report Card: Update for 2015.
Rising
temperatures are reducing the amount of vegetation on land, causing
a general
“browning” of
the Arctic tundra and reversing the “greening” trend of the past
three decades. Beyond simply altering the landscape, this loss of
vegetation has consequences for the frozen ground that lies beneath,
known as permafrost. Prof
Howard Epstein from
the University of Virginia told a press conference at AGU how
vegetation helps to keep temperatures down in summer, reducing the
amount of permafrost at risk of thawing. He said:
Increasing
the vegetation on the landscape will do a couple of things: it
provides insulation to whatever’s below the vegetation…Vegetation
tends to trap windblown snow, and that can also provide an insulating
effect for winter soils.
Vegetation
also changes the reflectivity of the land, known as the albedo. Fewer
plants means a less reflective surface, which could lead to faster
warming of the overlying air, says Epstein.
COP21
and the 2C limit
Coming
just days after countries signed a historic
agreement in
Paris to curb greenhouse gas emissions, nowhere demonstrates the need
to limit warming more than the Arctic, says Dr
Martin Jeffries,
Arctic science advisor at the US Office for Naval Research and lead
author of today’s report. He tells Carbon Brief:
COP21
calls for a global average of 2C as a maximum for the rise in global
temperature. We already know that the world is not uniformly warming,
but in some places such as the Arctic, it’s warming much more
quickly.
Models
suggest that an average global temperature rise of 2C would mean the
Arctic experiences much higher warming, Overland told today’s press
conference:
If
the globe goes to 2C warming, we’re looking at 4-5C warming in the
winter for the Arctic by 2040 or 2050. That’s based upon the CO2
that we’ve already put into the atmosphere and will be putting in
for the next 20 years.
The
Arctic is already in “adaptation mode”, says Overland, because of
the impacts humanity’s past emissions have locked us into. Cutting
our emissions now to meet the 2C goal would have a bigger influence
in the second half of the century, he explains.
The
next generation may see an ice-free summer, but hopefully their
descendents will see a return of more sea ice later in the century.
One
bit of good news, Overland concludes, is the close association
between air temperature and sea ice. If we stabilise global
temperature, we can stabilise the Arctic climate as well.
No comments:
Post a Comment
Note: only a member of this blog may post a comment.