

Arctic Sea Ice Goes Far Beyond Record Low Extent for May
20
May, 2016
The
sea ice that coats the Arctic Ocean each winter and erodes each
summer is going through its most depleted spring since modern
observing began. The Danish Meteorological Institute reported the
lowest sea ice extent of any April in the Arctic’s 38-year-long
satellite record. As luck would have it, the primary satellite
sensor used by the National Snow and Ice Data Center (NSIDC) for
extent measurement began
producing spurious data in April.
A similar microwave imager from another satellite is now
in the process of being intercalibrated to
ensure consistency of the long-term record. Even with that caveat,
it’s clear that the unusually rapid ice loss from April is
steaming ahead. NSIDC’s Mark Serreze confirmed in an email that
the 2016 Arctic sea ice extent is indeed at record-low levels for
May, as implied by Figures 1 and 2. Different agencies use different
algorithms to measure sea ice extent, but the slight variations that
result do not affect the big picture.
 Figure
1. Extent
of Arctic sea ice for each year since 1979. The 2016 values through
May 18 are shown as a dashed red line, denoting the provisional
state of the data for the last few weeks. NSIDC cautions that
“quantitative comparisons with other data should not be done at
this time.” Image credit: NSIDC
Charctic Interactive Sea Ice Graph.
Figure
1. Extent
of Arctic sea ice for each year since 1979. The 2016 values through
May 18 are shown as a dashed red line, denoting the provisional
state of the data for the last few weeks. NSIDC cautions that
“quantitative comparisons with other data should not be done at
this time.” Image credit: NSIDC
Charctic Interactive Sea Ice Graph.
 Figure
2. Arctic
sea ice extent for the past five years as tracked by the Danish
Meteorological Institute. The 1979-2000 average is depicted as a
gray line; the gray shading denotes one standard deviation from that
average. Image credit: Danish
Meteorological Institute.
Figure
2. Arctic
sea ice extent for the past five years as tracked by the Danish
Meteorological Institute. The 1979-2000 average is depicted as a
gray line; the gray shading denotes one standard deviation from that
average. Image credit: Danish
Meteorological Institute.
This year’s hasty ice retreat has been fueled by incredibly mild temperatures across the Arctic during much of the winter and spring--a byproduct of El Niño atop longer-term warming from human-produced greenhouse gases. At Barrow, Alaska, every day since January 1 has been above average except for January 22, February 6, and a stretch from March 28 to April 3. Alaska’s Climate Division 1, which covers the North Slope, is having its warmest year to date by far (see Figure 3), with the January-to-April average of 2.7°F beating the previous record (–1.4°F, from 2014) by an eye-popping 4.1°F. Another red-letter data point: snow cover disappeared from the open tundra at the NOAA Barrow Observatory on May 13. Assuming that no snow cover returns this spring--an increasingly good bet--this is the earliest melt-out date by far in 74 years of recordkeeping at the Barrow lab,beating out May 24, 2002. Conditions have also been exceptionally mild on the other side of the Arctic. The town of Longyearbyen in Svalbard, Norway--the northermost civilian community on the planet--has had only one below-average day in 2016 thus far (see Figure 4).
 Figure
3. Average
January-through-April temperatures from 1925 to 2016 for
Alaska’s Climate
Division 1,
covering the North Slope (which includes the Arctic Ocean
coastline). Image credit: NOAA/NCEI.
Figure
3. Average
January-through-April temperatures from 1925 to 2016 for
Alaska’s Climate
Division 1,
covering the North Slope (which includes the Arctic Ocean
coastline). Image credit: NOAA/NCEI.
 Figure
4. Daily
temperatures (red and blue traces) from April 2015 to April 2016 for
Svalbard Airport, Norway. The black line shows normal (average)
temperatures for each day. The smoothed average for Svalbard has
been above normal for the entire 12-month period. Only one day in
2016 has fallen below average. Image credit:Norwegian
Meteorological Institute.
Figure
4. Daily
temperatures (red and blue traces) from April 2015 to April 2016 for
Svalbard Airport, Norway. The black line shows normal (average)
temperatures for each day. The smoothed average for Svalbard has
been above normal for the entire 12-month period. Only one day in
2016 has fallen below average. Image credit:Norwegian
Meteorological Institute.
Mild readings still on tap across the Arctic
Figure
1. Extent
of Arctic sea ice for each year since 1979. The 2016 values through
May 18 are shown as a dashed red line, denoting the provisional
state of the data for the last few weeks. NSIDC cautions that
“quantitative comparisons with other data should not be done at
this time.” Image credit: NSIDC
Charctic Interactive Sea Ice Graph.Figure
2. Arctic
sea ice extent for the past five years as tracked by the Danish
Meteorological Institute. The 1979-2000 average is depicted as a
gray line; the gray shading denotes one standard deviation from that
average. Image credit: Danish
Meteorological Institute.This year’s hasty ice retreat has been fueled by incredibly mild temperatures across the Arctic during much of the winter and spring--a byproduct of El Niño atop longer-term warming from human-produced greenhouse gases. At Barrow, Alaska, every day since January 1 has been above average except for January 22, February 6, and a stretch from March 28 to April 3. Alaska’s Climate Division 1, which covers the North Slope, is having its warmest year to date by far (see Figure 3), with the January-to-April average of 2.7°F beating the previous record (–1.4°F, from 2014) by an eye-popping 4.1°F. Another red-letter data point: snow cover disappeared from the open tundra at the NOAA Barrow Observatory on May 13. Assuming that no snow cover returns this spring--an increasingly good bet--this is the earliest melt-out date by far in 74 years of recordkeeping at the Barrow lab,beating out May 24, 2002. Conditions have also been exceptionally mild on the other side of the Arctic. The town of Longyearbyen in Svalbard, Norway--the northermost civilian community on the planet--has had only one below-average day in 2016 thus far (see Figure 4).
Figure
3. Average
January-through-April temperatures from 1925 to 2016 for
Alaska’s Climate
Division 1,
covering the North Slope (which includes the Arctic Ocean
coastline). Image credit: NOAA/NCEI. Figure
4. Daily
temperatures (red and blue traces) from April 2015 to April 2016 for
Svalbard Airport, Norway. The black line shows normal (average)
temperatures for each day. The smoothed average for Svalbard has
been above normal for the entire 12-month period. Only one day in
2016 has fallen below average. Image credit:Norwegian
Meteorological Institute.
Figure
4. Daily
temperatures (red and blue traces) from April 2015 to April 2016 for
Svalbard Airport, Norway. The black line shows normal (average)
temperatures for each day. The smoothed average for Svalbard has
been above normal for the entire 12-month period. Only one day in
2016 has fallen below average. Image credit:Norwegian
Meteorological Institute.Mild readings still on tap across the Arctic
Recent runs of the ECMWF and GFS models maintain high pressure over the central and western Arctic for the next 1 to 2 weeks. This implies plenty of sunlight over large parts of the ice pack, which will facilitate ice loss. The 00Z Friday run of the GFS model keeps warmer-than-average surface temperatures across the entire Arctic Ocean throughout the extended range. At times, the warmth will extend across large parts of boreal Siberia, Alaska, and Canada, which will keep land-based snow melting quickly. Northern rivers are already feeding large volumes of relatively mild water into the Arctic ahead of usual. April’s snow cover extent across the Northern Hemisphere was the lowest in 50 years of recordkeeping, according to the Rutgers University Global Snow Lab.
Another downside of premature snow cover loss is the potential for early-season wildfire across the far north. A prime example is Canada’s disastrous Fort McMurray fire, which exploded in early May as record heat swept over a snowless landscape. Although the fire still surrounds the city, some 85 to 90 percent of Fort McMurray’s structures were saved, and residents may be able to return beginning in early June. Media interest in the event has waned in recent days, but the fire continues to rage, with a new burst of growth this week. On Thursday, the fire covered some 1.2 million acres--twice the size of Rhode Island--and was beginning to extend into Saskatchewan. As noted by blogger Robert Scribbler, this fire already has spanned more area than all of Alberta’s fires in 2015 combined. Soot from the Fort McMurray fire, and from major wildfires burning across parts of Siberia, could exacerbate the loss of sea ice by falling atop the ice and darkening the surface, thus increasing its ability to absorb sunlight.
 Figure
5. A
group trying to rescue animals from Fort McMurray wait at road block
on Highway 63 near as smoke rises from a forest fire near Fort
McMurray, Alberta on May 6, 2016. Canadian police led convoys of
cars through the burning ghost town of Fort McMurray Friday in a
risky operation to get people to safety far to the south. Image
credit: Cole Burston/AFP/Getty Images.
Figure
5. A
group trying to rescue animals from Fort McMurray wait at road block
on Highway 63 near as smoke rises from a forest fire near Fort
McMurray, Alberta on May 6, 2016. Canadian police led convoys of
cars through the burning ghost town of Fort McMurray Friday in a
risky operation to get people to safety far to the south. Image
credit: Cole Burston/AFP/Getty Images. Figure
6. Satellite
imagery showing the extent of sea ice on September 11, 2015, the
date of the year’s minimum extent. The minimum of 4.41 million
square kilometers was about 700,000 sq km below the 1981-2010
average, shown here as a gold line. Image credit: NASA
Goddard Scientific Visualization Studio.
Figure
6. Satellite
imagery showing the extent of sea ice on September 11, 2015, the
date of the year’s minimum extent. The minimum of 4.41 million
square kilometers was about 700,000 sq km below the 1981-2010
average, shown here as a gold line. Image credit: NASA
Goddard Scientific Visualization Studio.Record low sea ice extent this summer? Too soon to tell
Strange as it seems, there is no guarantee that this spring’s headlong melt will lead to the lowest Arctic sea ice minimum extent on record. Even with the unprecedented head start, more than two-thirds of the melting in a typical year has yet to occur. The final outcome of the melt season will hinge largely on the weather and the circulation patterns that unfold over the next three months or so--especially the amount of sunshine in June and July and the presence of winds and ocean currents that can shove thick, older ice toward lower latitudes. In 2012, the ice extent was just slightly below average in early June, but rapid melt later that month helped push the ice extent to its lowest value on record: 3.41 million square kilometers.
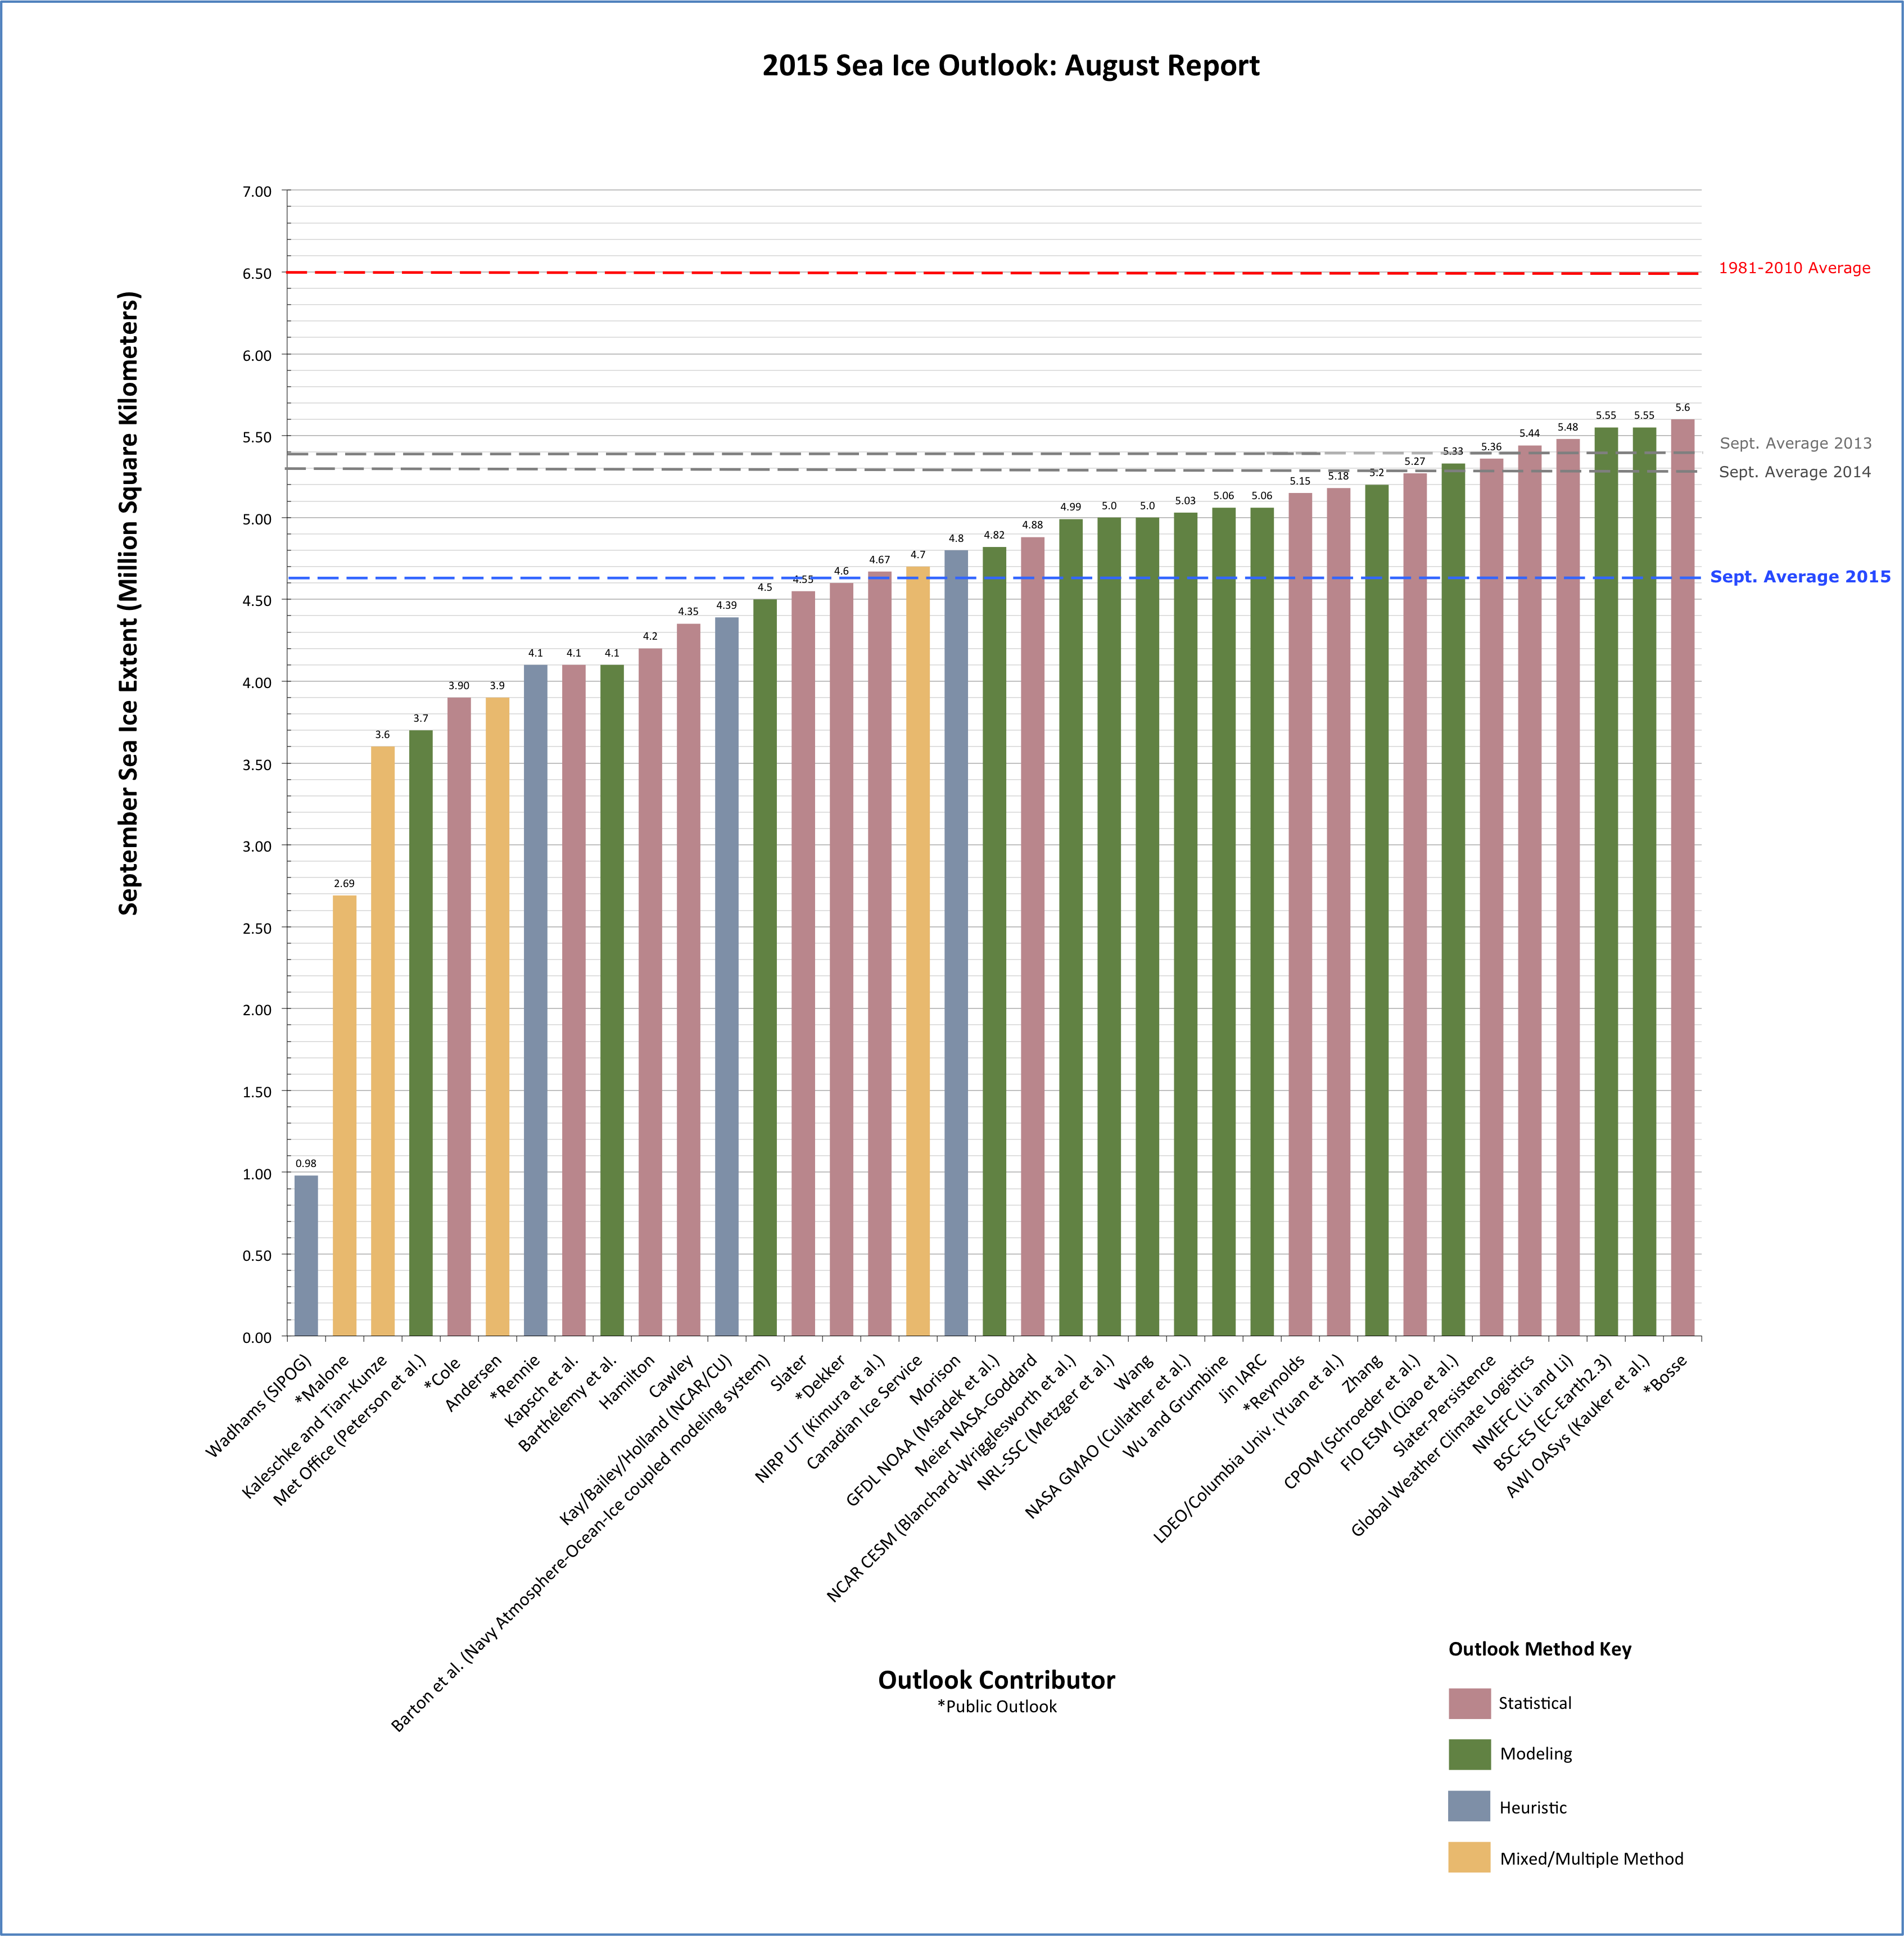
Some of the world’s top sea ice watchers will soon be putting their skills to work predicting the outcome of this year’s summer melt. A community forecasting project that began in 2008 has been operating as the Sea Ice Prediction Network since 2013. Each year SIPN compiles and releases outlooks from all interested parties who dare to predict the dates of ice-free conditions. Last year’s three monthly outlooks, issued in June, July, and August, included a total of 105 submissions employing various types of prediction (e.g., statistical techniques and modeling-based approaches). The forecasts issued in August 2015 spanned a vast range, from 0.98 to 5.6 sq km. The average of the August predictions--4.8 million sq km--was closer to the mark, but it still came in higher than the observed minimum of 4.41 sq km observed on September 11.
Sea ice prediction remains an embryonic science, and the SIPN website is an excellent place to follow that science as it evolves in real time. SIPN will be soliciting contributions several weeks ahead of its June, July, and August reports; here’s a tentative schedule.
Have a great weekend, everyone!
Bob Henson
No comments:
Post a Comment
Note: only a member of this blog may post a comment.