

The Human World Has Never Experienced A Time When Global Sea Ice Was So Weak and Reduced
13 January, 2017
Neven — one of the world’s most beloved sea ice trackers — has again taken a break from his much-earned sabbatical to issue yet one more warning on the state of global sea ice.
His report, based on this month’s bombshell National Snow and Ice Data Center statement, can best be described as an urgent call for action on the part of the global community to redouble efforts aimed at reducing the wide-ranging and expanding harms caused by the terrible warming trend we have artificially forced upon our world.
Neven is a kind, honest, and open soul. He is also one of the smartest and decent fellow bloggers I have had the good fortune of encountering in my many travels during my last four years of covering the slow motion global train wreck caused by our widespread and vastly irresponsible burning of fossil fuels. In other words, the man, in my view, has the moral and intellectual authority that many lack. We should listen to him.
Before the World Warmed, This Would Have Been a 1 in 30 Billion Probability Event
For, sadly, on the crucial issue of sea ice, a general muting of the subject has tended to continue despite a jaw-dropping plunge in both the coverage and volume of a substance so crucial to maintaining a stable global climate:
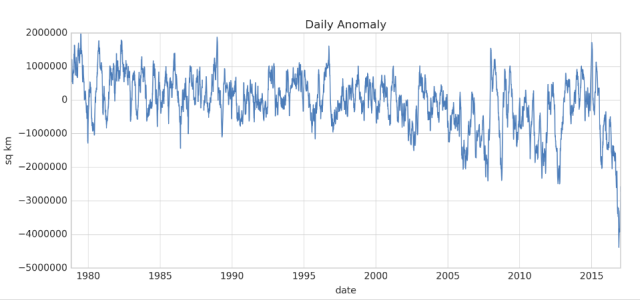
(Global sea ice extent fell off a cliff during December of 2016. The measure has now bounced back a little. But the global average remains significantly below past record lows for this time of year. Loss of so much sea ice can be highly disruptive to the climate system and related atmospheric circulation and precipitation patterns. Image source: NSIDC.)
During December, global sea ice extent coverage fell to an amazing 4.4 million square kilometers below average. This is far, far outside the 2 standard deviation range — passing to fully 8 standard deviations beyond the typical yearly average.
Under past expectations of average, the statistical probability of such an event is approximately 1 in 30 billion. Of course, it’s pretty obvious at this time that a normal, natural variability is not the underlying cause of such a great loss of sea ice. That the warmth we added to the system has now greatly tipped the scales beyond anything representing what would have previously been considered a normal range. A range that since the year 2000 had already tended to dip below average more and more frequently. But one that has never seen so much ice lost.
Unprecedented Loses
This area of sea ice removed — enough to change how the face of our Earth looks from space — is approximately the size of two Greenlands (Note that sea ice loss does not directly contribute to sea level rise. But loss of protective sea ice can contribute to land ice melt — which does add to rates of sea level rise.). And it has been roughly split between the Arctic in the north and the Antarctic in the south.
If sea ice extent losses appear bleak, then sea ice volume losses seem even worse. Sea ice extent is a rough measure of the surface of the world covered by ice excluding gaps behind the leading ice edge. Sea ice volume, however, measures both the ice area — including gaps — and the ice thickness.
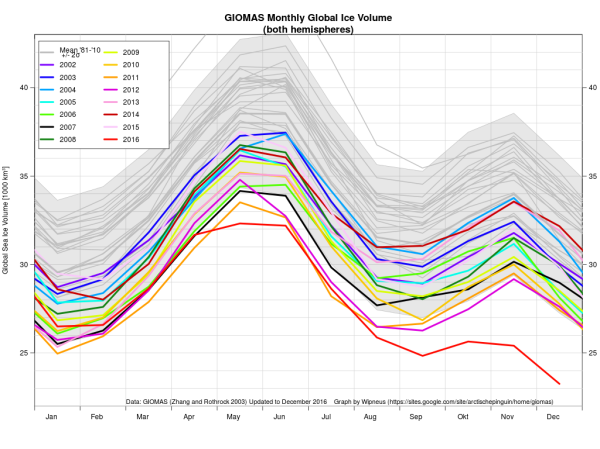
(Globally, we’ve lost about 1/3 of the total volume of sea ice since the 1980s. 2016’s record fall in the measure coincided with record hot global temperatures and an abnormal period of polar warming that continues on into 2017. Image source: Wipneus.)
Late 2016’s big drop included the approximate removal of 1/3 of the world’s sea ice volume when compared to 1981-2010 averages. In other words, 1/3 of all of the floating portion of the world’s cryosphere beyond the edge of anchored ice shelves had melted away during the period.
Record Global Temperatures as Prime Cause For North and South Pole Sea Ice Melt
In the north, extremely warm temperatures ranging from 2 to up to 7 degrees Celsius above average for the Arctic Ocean region have helped to drive these unprecedented fall and winter sea ice losses. In the south, warmer than normal surface conditions appear to have also helped to drive the amazing coordinate losses there. And overall, 2016 has shown warm to extremely warm conditions for both poles during a year in which global temperatures have spiked to around 1.2 degrees Celsius above 1880s averages.
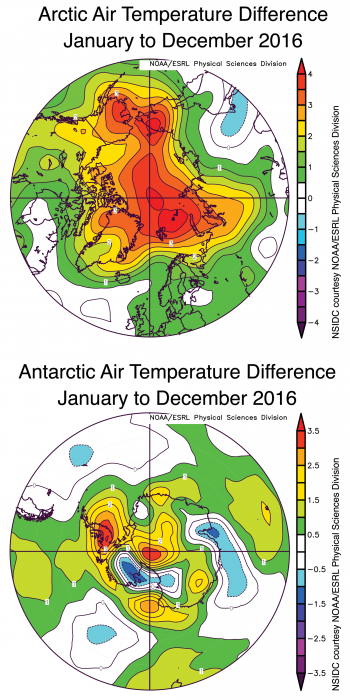
(Extremely strong polar amplification during 2016 is the likely primary contributor to sea ice loss in both the northern and southern polar regions. Image source: NSIDC.)
Under polar amplification — a condition associated with the human-forced warming of our world — scientists expected that the polar regions would tend to warm faster than the rest of the Earth surface. And during 2016, this global warming related condition presented effects writ large. The damage to sea ice, so far, has been monumental. And these losses have continued into 2017 — even if they are somewhat less below the record low line than during their period of maximum departure this past December.
Albedo Losses and a Bad Set-up for Arctic Summer
Sea ice loss generates its own form of amplifying feedback — in which already prevalent polar warming can worsen further. Less ice coverage means that during summer more of the dark ocean surface is presented to absorb the sun’s rays.
This replacement of a white, reflective surface with a dark blue, absorptive one means that still more heat will tend to be trapped in the polar environment. In addition, during winter, less ice cover means that the warmer ocean beneath will tend ventilate more heat and heat-trapping water vapor into the polar atmospheres. And it’s this kind of self-reinforcing cycle that can tend to lock in the dangerous changes like worsening severe weather, worsening heatwaves in the middle and lower latitudes, and the increasing rates of land glacier melt and sea level rise that scientists have been warning about for so long. And it’s this kind of disruptive longer term climate trend that we are being drawn into at this time.
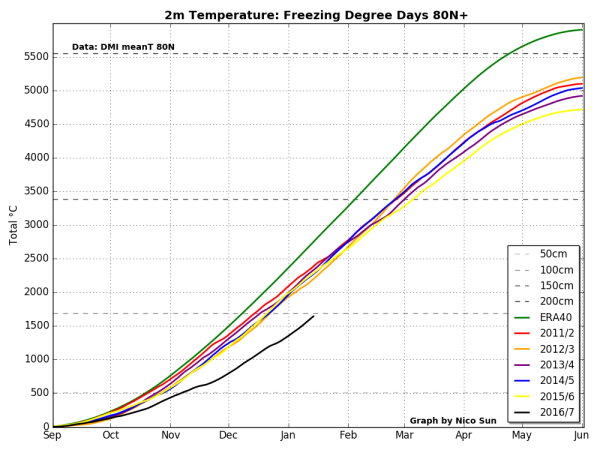
(Freezing degree days for the crucial 80 N region have significantly departed into record low ranges. The less freezing degree days, the closer this region is to thawing. Image source: Tealight. Data Source: DMI.)
Nearer term, it appears that the polar heat which has already so greatly damaged the Arctic sea ice is set to stay. Over the next few days, the Arctic appears set to experience a powerful series of low pressure systems running in from the Barents side between Svalbard and Siberia. Neven warns that these storms will tend to push a considerable portion of the remaining thick ice out of the Arctic and through the Fram Strait. Over the next couple of weeks, global forecast models indicate that above freezing temperatures will tend to invade regions now covered by sea ice in Hudson Bay, Baffin Bay, and in the Chukchi Sea. Though the ice is trying to grow, such repeated insults will tend to keep ice coverage in record low ranges.
If this trend of warmth, storms and ice export continues through February, March and April — as it has during October, November, December and January — then the set up for the 2017 melt season would be about the worst we have ever seen. And that would tend to increase the likelihood of new record minimums being reached during September all while hastening the day when the Arctic experiences near ice free conditions. Lets hope that doesn’t happen. But, so far, the trends for the winter of 2016-2017, from pole to pole, have followed along the lines of a near worst case scenario.
Links:
Global Sea Ice Records Broken Again
National Snow and Ice Data Center Sea Ice News
Wipneus Sea Ice Graphs
NASA GISS Temperature Data
Polar Amplification
Tealight
DMI
Hat tip to Suzanne
Hat tip to Cate
Hat tip to Colorado Bob
No comments:
Post a Comment
Note: only a member of this blog may post a comment.